But with that said - there are still some significant limitations in the Salesforce Custom Report system that need more individualized solutions. The custom reporting system in salesforce is meant to be "universal", meaning, it is designed to meet the various needs of millions of different users. But frequently, a company needs a reporting system designed around their exact process or data model.
Custom Reporting Done in Visualforce
To meet the needs of these clients we usually resort to Visualforce, a system within Salesforce.com that allows us to run custom code, written in apex, in the cloud. Visualforce gives us the ability to build "custom user interfaces".
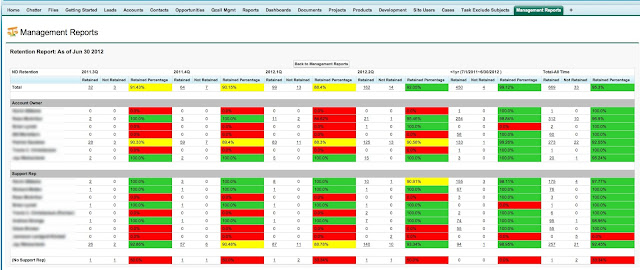
An Example Visualforce Custom Salesforce.com Report
Since a report is just a presentation of data. Visualforce gives us all the power to produce the exact custom report that a client might need. When building a custom visualforce based report, we write our code to go get the data needed, assemble it properly, and display it in whatever format is most useful to the end user.
 |
| A Custom Report built in Visualforce |
See the above example. In that report the client needed to assemble and display data in a way that could not be handled by the standard salesforce reporting system. Here we were able to summarize it as needed, group the dates as needed, compare "Retained" vs "Not Retained", calculate a percentage, and color code the results to make the data easy for the reader to interpret.
Be sure to note: this is entirely custom! I'm not showing you a canned product that we sell or some third party reporting solution. The client, along with a Snapptraffic consultant, discussed the business problem, identified that data upon which a report was needed, discussed the output desired, and our developers wrote the apex code needed to produce the above output.
Drill Downs
Also notice the "Drill Downs" - if you look closely (I know, the image is small), you'll see that many of the numbers in the report are links. Those links open a report that provide the reader with the exact data that makes up the numbers in each cell. The next image is one of those drill downs:
 |
| Drill Down on the Exact Data Needed |
Here you can see the opportunities that make up one of the numbers in the table above.
Export to Excel
If you look closely at the above image, you'll also see an "Export to Excel" button. This was added at the customer's request and pushes the data in the drill down to an excel file so that they can do further analysis on their own.
Have it your way!
The beauty of using Visualforce to build these reports is that there are so few limitations. Want to email the results? No problem. Push data to excel? You can have it. Compare data from completely independent objects in Salesforce? Easy. Seriously, you can have it your way.
Edit Underlying Data?
How about this interesting use case - The client wanted to be able to report on progress towards calling goals (they did webinars, look for that word in the example). We created a custom object into which the webinar call goals could be stored. The report became an interface where users could view their progress toward the goal - along with appropriate color coding - and an area where managers could input the goals (only users with appropriate permissions set could edit the goals).
So not only was this a report, it was a goal management system - both reporting on and allowing management of the company webinar calling effort.
Charts?
Salesforce.com also comes with a powerful dashboarding system, allowing the user to easily create charts in order to display graphically the data contained in an underlying report. It stands to reason though, that if the underlying reporting system has limitations, then so too will the dashboard charts. We get around this using Google Visualizer.
Google has provided a powerful system into which we can feed data, pass certain parameters, and receive back from google the chart requested. Here is an example of that:
 |
| Google Visualizer Charts Rendered in Salesforce.com Visualforce |
Notice the "switches" we provided the user at the top. They can select their regions, display method, and pick their desired date range. Entirely custom, built to meet their needs.
So if you find that your reporting needs go beyond what the Salesforce.com Reporting Engine can provide, then reach out to us at www.snapptraffic.com
We'd be happy to meet with you, discuss the reports that you need, give you an estimate for having them built, and get them made for you in a timely manner.

